Back to Research & Publication
World Happiness Report EDA

Introduction
In a recent conversation with my parents, I pondered why exactly some countries are considered “happier.” It’s common knowledge that Scandinavia and some other parts of Western Europe consist of model countries, but most of us in the US - myself included - have never been, and I can only imagine things are wildly different there. It’s hard to compare and contrast all of the parts that comprise a country’s whole. Tax rates, government, advances in technology, weather, and other variables can play into how happy a country’s citizens are on average. Furthermore, what exactly “happiness” entails is rather ambiguous, so it can also be difficult to define happiness for our purposes.
In recent years, happiness has become the strongest indicator of a country’s social progress. That’s why the World Happiness Report was first published in 2012 for the UN High Level Meeting on well-being. In 2017, another edition was published with more recent information.
How does one measure happiness, you ask?
That’s a good question. Some members of my committee and I were skeptical too. The report uses six key variables to measure happiness differences: “income, healthy life expectancy, having someone to count on in times of trouble, generosity, freedom and trust, with the latter measured by the absence of corruption in business and government.”
This data comes from the Gallup World Poll’s survey scores, which adopted the “Cantril’s Ladder of Life Scale” as an assessment for well-being. It asks of respondents:
Please imagine a ladder with steps numbered from zero at the bottom to 10 at the top. The top of the ladder represents the best possible life for you and the bottom of the ladder represents the worst possible life for you. On which step of the ladder would you say you personally feel you stand at this time? (ladder-present) On which step do you think you will stand about five years from now? (ladder-future)
Here’s a slice of the table. These countries are sorted by their happiness scores, with values for each of the variables. As you can see, values are pretty similar for GDP, family, life expectancy, and freedom, with more variance in generosity in trust. So, you might expect that the last two might be worth less when computing happiness. My aims in this post are to determine which of the variables are most important to a country’s freedom, and also to explore plots within the individual variables.

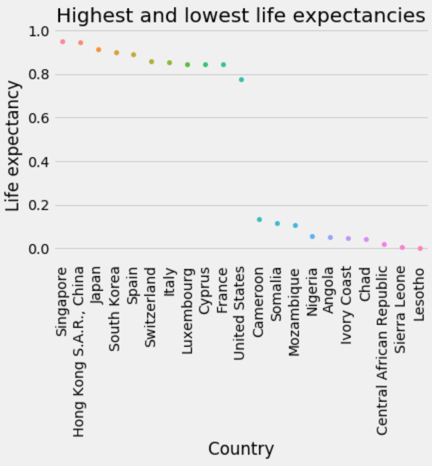
Next, for each of the six variables we’ll look at the highest-scoring ten countries in 2017, plotted along with the lowest-scoring ten, just because I thought it would be interesting to see where which countries lie on the various spectrums. I’ve also included the United States so we can see where we stand against the rest of the world (assuming you’re reading in the U.S.)


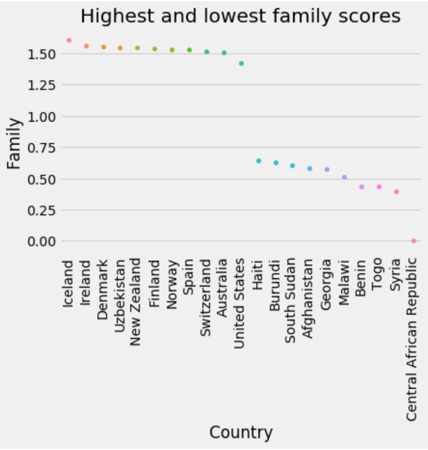
Family values, that is to say, countries where citizens “have someone to count on in times of trouble”.
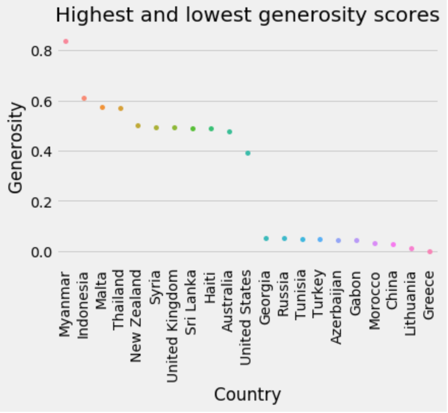
At first, I was surprised to see Myanmar so far up on the list for generosity, given the current situation with the Rohingya, and the fact that it’s not a relatively wealthy nation. However, after doing a little bit of research, I realized that the way a country’s “generosity” was calculated was by simply calculating the proportion of Myanmarese that reported donating money to charity, etc. That is, generosity is defined by how many citizens give, not how much they give.

The top 30 countries by trust in government in 2017. This was determined according to absence of corruption in business and government. If you were wondering, the US is 47th of 159 on this list, and given all that’s happened in the past few months, things may have changed.
Correlation
Which of the six variables most affect a country’s “happiness”? This is the question I sought out to answer—is it a country’s government or economy that makes its citizens the most happy?
We can create scatter plots and perform regression to see how correlated a variable is with happiness score, like so:
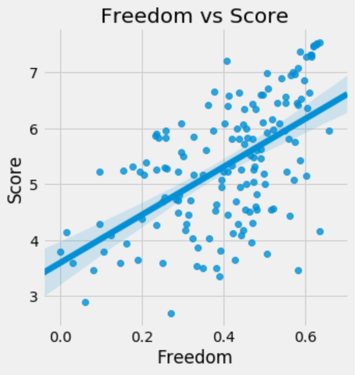
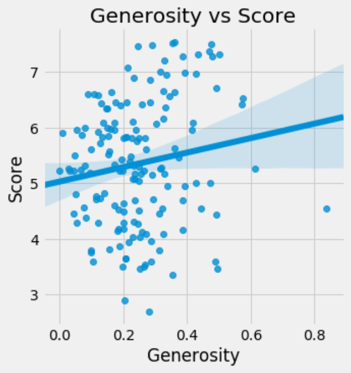


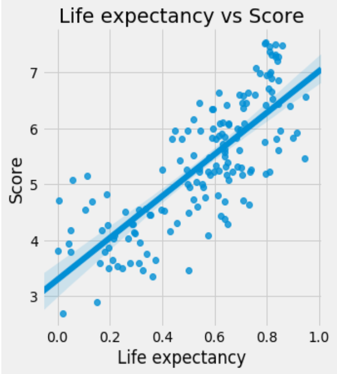
As you can see, some variables appear to be highly correlated with happiness, such as GDP and life expectancy, but it’s still hard to compare their correlations with one another.


Here we can examine each factor's correlation with the overall happiness score for the year 2017. Clearly, economy is the most determining factor. It would make sense that the more money a country has to spend, the happier its citizens will be. I, personally, was most surprised by how low-ranking government-corruption was.
We can also see how correlated the six variables are with one another:

Something I found especially interesting in this heatmap is that generosity and GDP per capita are negatively correlated. This isn’t monumentally surprising, but I was kind of disappointed to see that wealthier nations tend to be less generous regardless.
Conclusion
To wrap things up, this was an exploratory data analysis into why some countries are considered “happier” than others. We found that GDP per capita is the most important factor, which would make sense because money allows countries to afford luxuries along with basic resources. Despite all this, however, there are many, many more things that affect a country’s happiness and I doubt there are models sophisticated enough to accurately measure this.
The data I used is from here, and I used Pandas, Matplotlib, and Seaborn for data analysis.
As for the Gallup World Poll—surveys are conducted on sample sizes of approximately 1000, depending on the size of the country and are done through telephone or face-to-face for developing countries. More can be found here.
Semester
Fall 2017
Researcher
Sydney Yang
